How to Find Clients for Your NEMT Business: The 2026 Growth Playbook
Learn how NEMT providers secure private pay contracts in 2026 through local SEO, facility partnerships, and referrals, bypassing low-margin Medicaid brokers.
Read more

Running a Non-Emergency Medical Transportation (NEMT) company requires you to watch performance numbers closely. Tracking the right metrics keeps your service reliable and profitable. Four key indicators tell you how well your operations work: vehicle use, on-time pickups, driver idle time, and cost per trip. With the right tools, you can measure, track, and act on these numbers every day.
Vehicle utilization shows how much of your fleet’s time goes toward active trips instead of sitting idle.
Formula:
Vehicle Utilization (%) = (Time or miles with passengers ÷ Total available time or miles) × 100
Why it matters:
Unused vehicles cost money. Fuel, maintenance, and insurance continue even when a vehicle is parked.
How to improve:
Example: A fleet with 20 vans sees only 60% active use. Reassigning low-demand vehicles to high-traffic zones can raise utilization to 80%, cutting wasted time and cost.
This shows how often you arrive within the promised pickup window.
Formula:
On-Time Pickup (%) = (Trips picked up on time ÷ Total trips) × 100
Why it matters:
Late arrivals reduce client trust and can cause missed appointments.
How to improve:
Example: A company improves from 84% to 94% on-time pickups by adjusting schedules and adding automatic driver alerts.
Idle time is the period when a driver is available but not moving passengers. It increases cost and lowers productivity.
Why it matters:
Drivers get paid for logged-in time whether they move or wait. High idle time means lost efficiency.
How to improve:
Example: Reducing idle time from 25% to 12% can raise completed trips per driver by 15%.
Discover how an all-in-one NEMT solution can automate scheduling, plan routes and simplify billing so you can focus on delivering exceptional care.
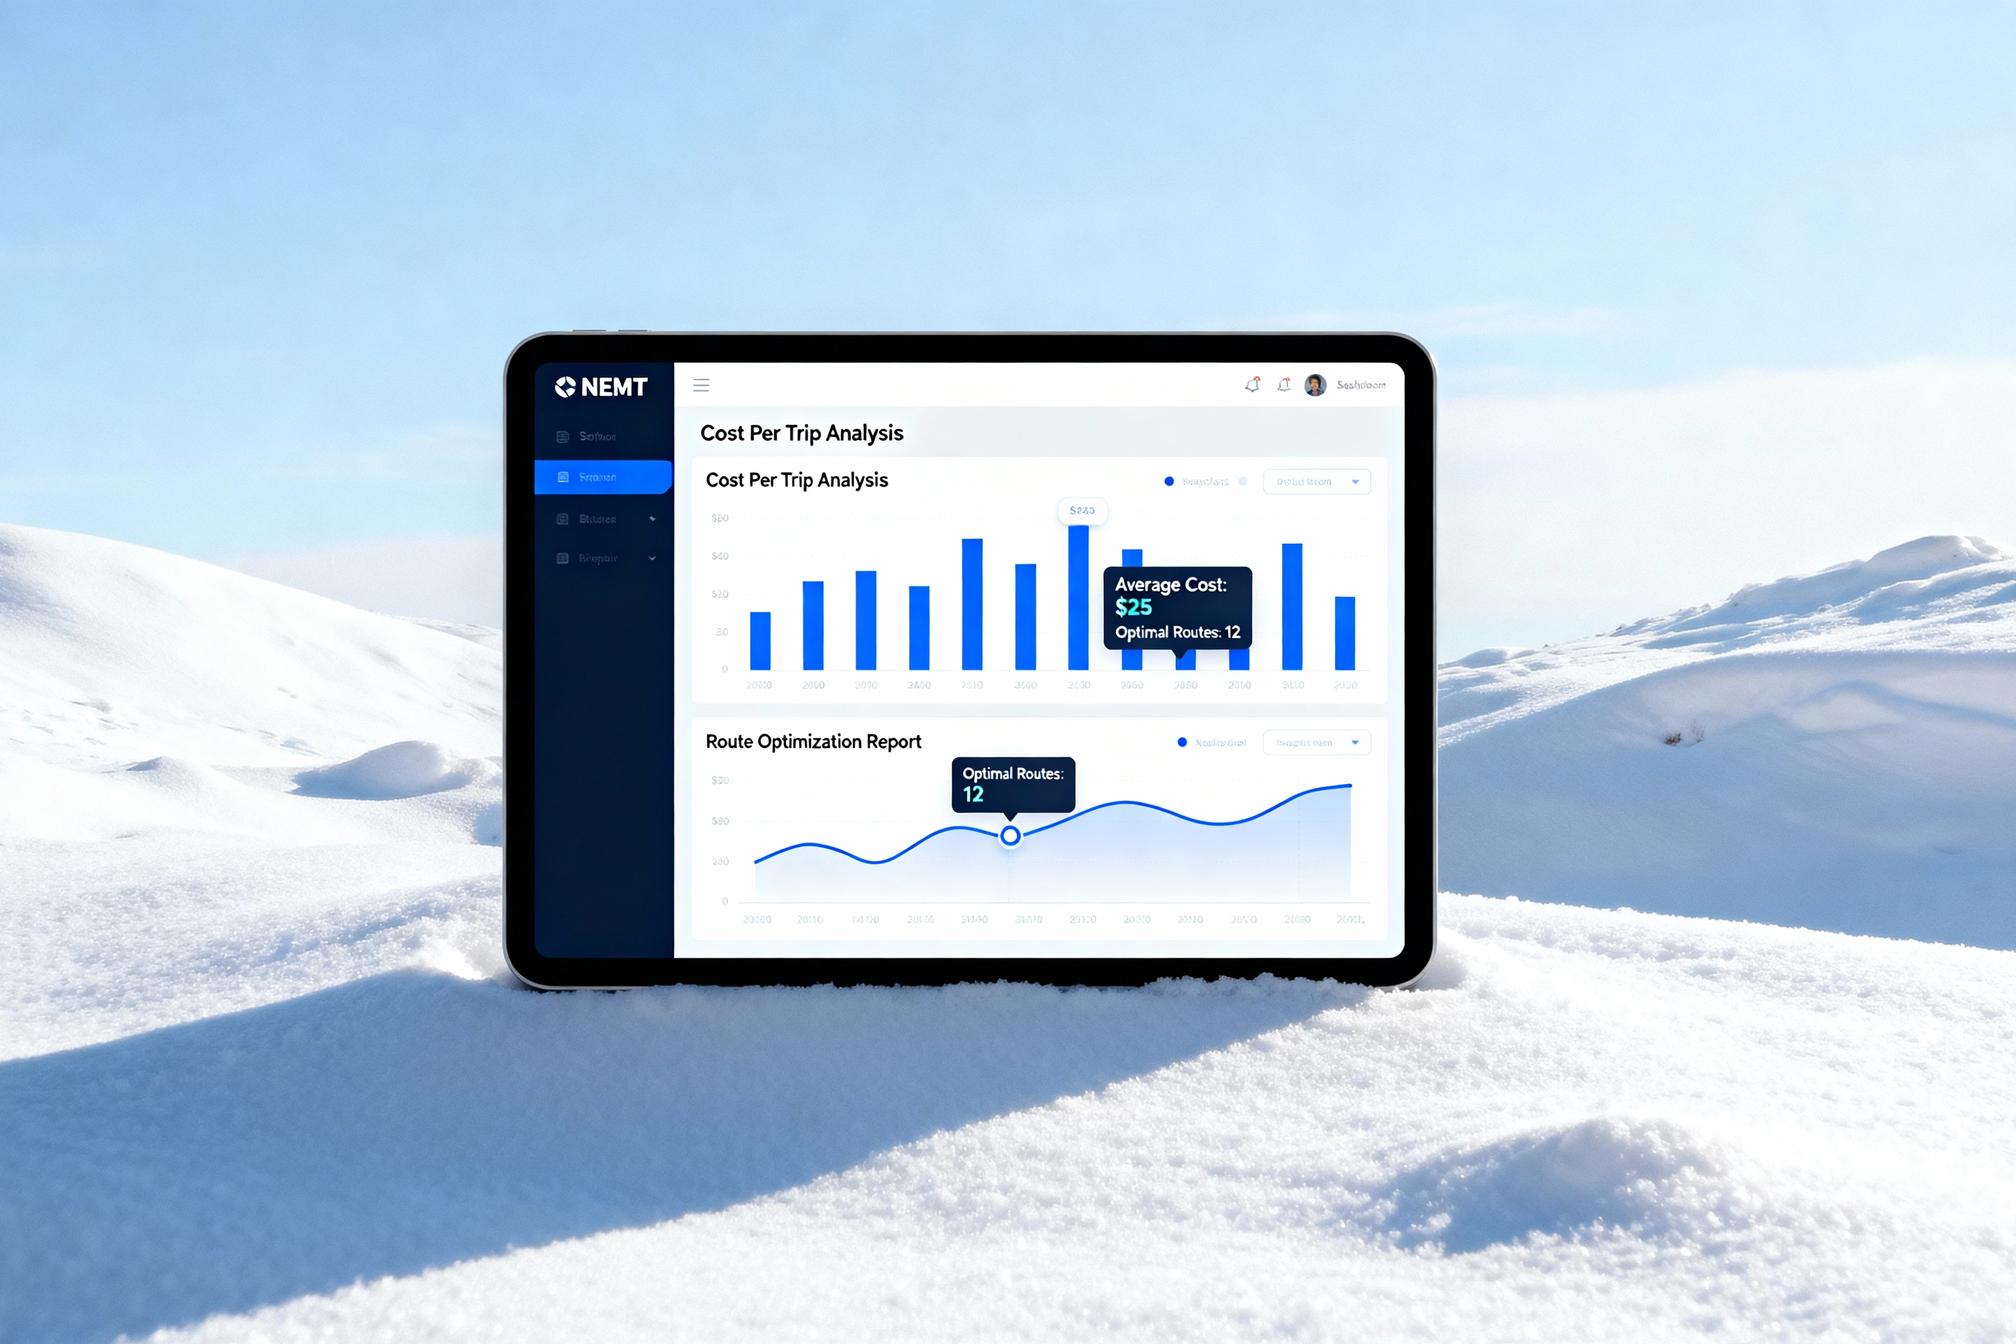
This metric combines all expenses—fuel, wages, repairs, insurance, and overhead—into a single figure.
Formula:
Cost per Trip = Total Operating Costs ÷ Total Trips
Why it matters:
It helps you know if each trip earns enough to cover expenses.
How to improve:
Example: Lowering cost per trip from $45 to $38 can increase monthly profit without adding vehicles.
Manual tracking wastes time. Dashboards in NEMT software give you real-time numbers.
A good dashboard shows:
You can filter results by driver, vehicle, or service type. The system can also send alerts when targets fall short.
Visit nemtplatform.com or explore the Provider Panel to see how your data appears live and updated.
NEMT Platform gives you clear control over every trip and driver. It tracks performance numbers in real time, including vehicle use, pickup timing, driver activity, and cost per trip. You can view reports, set alerts, and take quick action without manual checks. The system brings together dispatch, scheduling, billing, and reporting in one connected space so your team can run daily operations with speed and accuracy.
Learn how NEMT providers secure private pay contracts in 2026 through local SEO, facility partnerships, and referrals, bypassing low-margin Medicaid brokers.
On July 4, 2026, the United States marks 250 years of independence. This post walks through that history and connects it to what NEMT operators deal with today: broker credentialing, compliance audits, dispatch pressure, and a fast-growing demand base with flat funding behind it.
Long-distance NEMT trips are the fastest way to increase per-trip revenue. This guide shows you how to build a long-trip business model, where to find the contracts, and how to structure your operations so distance runs stay profitable.
Profitability in NEMT comes from three things: controlled startup costs, consistent broker contracts, and operational efficiency. Miss any one and you'll spend the first 18 months losing money. This guide walks you through the steps and shows you where the real money leaks happen.