



The short answer: Enterprise NEMT operators should track twelve KPIs across four areas: revenue (first-pass claim acceptance, denial rate, days to payment), efficiency (cost per trip, deadhead miles, trips per vehicle hour), service (on-time pickup rate, no-show rate, complaints per 1,000 trips), and compliance (EVV capture rate, documentation completeness, incident rate). Together they show whether the operation is converting trips into margin, and where it is leaking.
A small NEMT operator can run the business by feel. The owner sees every trip, knows every driver, and notices problems as they happen. An enterprise operator running hundreds of vehicles across multiple locations cannot. At that scale, leadership only sees the operation through its numbers, which means the quality of your KPIs determines the quality of your decisions. This guide covers the twelve metrics that matter most for large NEMT operators, how to calculate each one, and why each one matters when you are running at volume.
Why do enterprise NEMT operators need KPIs?
Enterprise NEMT operators need KPIs because no one person can see a multi-location operation directly, so leadership has to manage by measurement and intervene by exception.
At enterprise scale, problems rarely announce themselves. A location slowly slips on on-time performance, one broker's denials creep up, deadhead miles grow a few points across the fleet. Each change is small and invisible from the ground. Measured consistently, they become obvious, and they become obvious early enough to fix. KPIs turn a sprawling operation into something leadership can actually steer: compare locations side by side, spot the outlier, and focus management attention where it produces the most return.
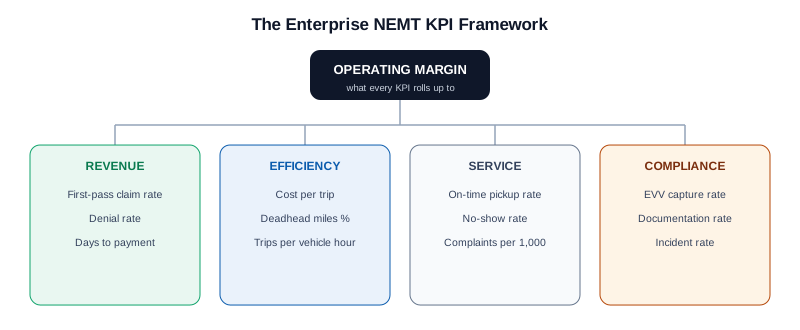
What are the revenue KPIs for NEMT?
The core NEMT revenue KPIs are first-pass claim acceptance rate, denial rate, and days to payment, because together they show how much billed revenue actually becomes cash, and how fast.
See your KPIs live, across every location
A walkthrough built around your locations, your brokers, and the metrics your leadership reviews.
1. First-pass claim acceptance rate
First-pass claim acceptance rate is the share of claims paid on their first submission, without rework or resubmission.
How to calculate: Claims paid on first submission divided by total claims submitted, over the same period.
Why it matters at scale: It is the cleanest single measure of billing health. Every claim that fails first pass costs staff time to rework and delays cash, and at enterprise volume a few points of first-pass rate represent a large amount of revenue.
2. Denial rate and denial reasons
Denial rate is the share of submitted claims rejected by the payer, tracked alongside the reason for each denial.
How to calculate: Denied claims divided by total claims submitted. Categorize every denial by reason, such as missing EVV, coding errors, or authorization issues.
Why it matters at scale: The rate tells you how much is failing; the reasons tell you why. Tracked by location and by broker, denial reasons point directly to the process that needs fixing.
3. Days to payment
Days to payment is the average time between a completed trip and the payment for it being received.
How to calculate: Sum of days from trip completion to payment receipt for all paid trips, divided by the number of paid trips.
Why it matters at scale: It measures how much working capital is tied up in trips you have already paid to deliver. Faster submission and fewer denials shorten it directly.
What are the efficiency KPIs for NEMT?
The core NEMT efficiency KPIs are cost per trip, deadhead miles percentage, and trips per vehicle hour, because they show whether the fleet and staff are converting capacity into completed, billable trips.
4. Cost per trip
Cost per trip is the total operating cost divided by the number of completed trips.
How to calculate: Total operating cost for the period (labor, fuel, vehicles, insurance, overhead) divided by completed trips in the same period.
Why it matters at scale: Reimbursement per trip is largely fixed by contracts, so cost per trip is where margin is won or lost. Compare it by location and trip type to find where the operation is running expensive.
5. Deadhead miles percentage
Deadhead miles percentage is the share of total miles driven without a passenger on board.
How to calculate: Empty miles divided by total miles driven, over the same period.
Why it matters at scale: Deadhead miles burn fuel, driver time, and vehicle life without producing revenue. It is a direct measure of how well trips are assigned and routed.
6. Trips per vehicle hour
Trips per vehicle hour measures how many completed trips each vehicle produces per hour in service.
How to calculate: Completed trips divided by total vehicle service hours.
Why it matters at scale: It is the clearest measure of fleet utilization. Low numbers mean you are paying for capacity you are not using, which usually points to scheduling or dispatch inefficiency rather than a need for more vehicles.
What are the service KPIs for NEMT?
The core NEMT service KPIs are on-time pickup rate, no-show rate, and complaints per 1,000 trips, because they drive the broker scorecards that decide contract renewals.
7. On-time pickup rate
On-time pickup rate is the share of pickups that happen within the time window defined by the broker or contract.
How to calculate: Pickups within the contracted window divided by total pickups.
Why it matters at scale: It is typically the most visible metric on broker scorecards. For an enterprise operator whose revenue is concentrated in a few broker contracts, on-time performance is contract protection.
8. No-show rate
No-show rate is the share of scheduled trips where the passenger was not present or did not take the ride.
How to calculate: No-show trips divided by total scheduled trips.
Why it matters at scale: Every no-show is a dispatched vehicle and driver producing an unbillable or reduced-rate run. Tracking it by facility and trip type shows where confirmation and reminders would recover the most capacity.
9. Complaints per 1,000 trips
Complaints per 1,000 trips normalizes member and facility complaints against trip volume.
How to calculate: Complaints received divided by completed trips, multiplied by 1,000.
Why it matters at scale: Normalizing by volume lets you compare locations of different sizes fairly. Rising complaint rates are an early warning of service problems before they appear on a broker review.
What are the compliance KPIs for NEMT?
The core NEMT compliance KPIs are EVV capture rate, documentation completeness rate, and incident rate, because they measure claim eligibility, audit readiness, and safety risk.
10. EVV capture rate
EVV capture rate is the share of completed trips with complete electronic visit verification data.
How to calculate: Trips with complete EVV divided by completed trips.
Why it matters at scale: Under the 21st Century Cures Act, EVV requires six data points for each service, and states are enforcing compliance thresholds. A trip without complete EVV is increasingly a claim at risk, so this rate protects both revenue and audit standing.
11. Documentation completeness rate
Documentation completeness rate is the share of trips with a full record: GPS trail, timestamps, signatures, and required notes.
How to calculate: Trips with complete documentation divided by completed trips.
Why it matters at scale: In an audit, the record has to defend itself. At enterprise scale, a documentation gap is not one missing file; it is a pattern repeated across thousands of trips.
12. Incident rate
Incident rate measures safety events such as accidents and passenger injuries relative to miles driven.
How to calculate: Incidents divided by total miles driven, multiplied by 100,000.
Why it matters at scale: It is a direct input to insurance cost and a major contract risk. Tracking it by driver and location shows where training or monitoring is needed.
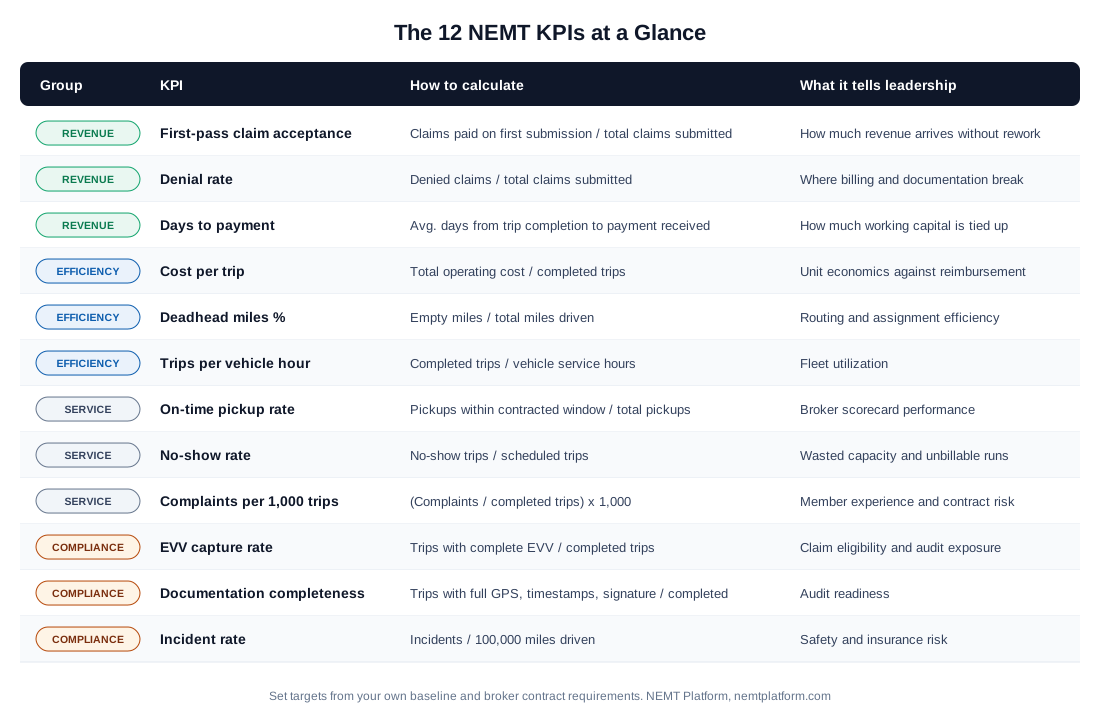
NEMT KPI summary table
This table lists all twelve enterprise NEMT KPIs with their formulas and what each one tells leadership.
How should enterprise operators set KPI targets?
Enterprise operators should set KPI targets from their own baseline and their broker contract requirements, then use location-to-location comparison to find the gaps worth closing.
Generic industry targets are a weak guide, because performance depends heavily on state, payer mix, trip types, and geography. The more useful approach has three parts. First, establish your own baseline for each KPI over a full quarter. Second, set floors from your broker contracts, since on-time windows and documentation requirements are usually defined there. Third, compare your locations against each other. Your best-performing location is proof of what is achievable in your own operation, and the gap between it and your weakest location is usually the most valuable improvement available.
Why do NEMT KPIs depend on unified data?
NEMT KPIs are only reliable when dispatch, driver, billing, and compliance data live in one system, because KPIs assembled from disconnected tools arrive late, conflict, and require manual reconciliation.
Most of these KPIs combine data from more than one part of the operation. Days to payment needs trip completion data and payment data. Cost per trip needs operational and financial data. EVV capture rate needs driver-app data matched to completed trips. When those live in separate tools, someone has to export, reconcile, and assemble the numbers by hand, which means leadership sees last month's picture, often with errors. When everything writes to one shared record, the KPIs are live, consistent across locations, and trustworthy enough to act on.
This is where a unified platform changes what leadership can see. The NEMT Platform runs dispatch, the driver app, billing, and compliance on one record, so reporting on trip volume, on-time rates, revenue, and broker performance comes from the same data the operation runs on. Across 450+ providers and more than 1M trips per month, the platform supports a 99.2 percent first-submission claim approval rate, 88 percent automated dispatch, and a 66 percent reduction in manual workload. Those are the KPIs that move margin, measured from the system itself.
See your KPIs live, across every location
A walkthrough built around your locations, your brokers, and the metrics your leadership reviews.
Frequently asked questions
What are the most important KPIs for an NEMT company?
The most important NEMT KPIs are first-pass claim acceptance rate, cost per trip, on-time pickup rate, and EVV capture rate. Together they cover revenue, efficiency, service, and compliance, the four areas that determine an operator's margin and contract standing.
How do you calculate cost per trip in NEMT?
Divide total operating cost for a period, including labor, fuel, vehicles, insurance, and overhead, by the number of completed trips in the same period. Compare the result by location and trip type to find where the operation runs expensive.
What is a good on-time rate for NEMT?
The right target depends on the pickup window defined in your broker contracts, which varies by broker and state. Start from the contractual requirement as the floor, then use your best-performing location as the benchmark for the rest of the operation.
How often should NEMT KPIs be reviewed?
Service and operational KPIs such as on-time rate and no-shows are most useful reviewed daily or weekly. Financial KPIs such as days to payment and cost per trip are typically reviewed monthly, and all twelve should be compared by location each quarter.
What is deadhead in NEMT?
Deadhead refers to miles a vehicle drives without a passenger, such as driving to a first pickup or between trips. Deadhead miles cost fuel and driver time without producing revenue, so a lower deadhead percentage indicates more efficient assignment and routing.
Related Articles
Switching NEMT Software at Scale: An Enterprise Migration Guide
How large NEMT operators switch software without disrupting trips or cash flow: a 7-phase migration plan, data checklist, and the vendor questions to ask first.